Hi,
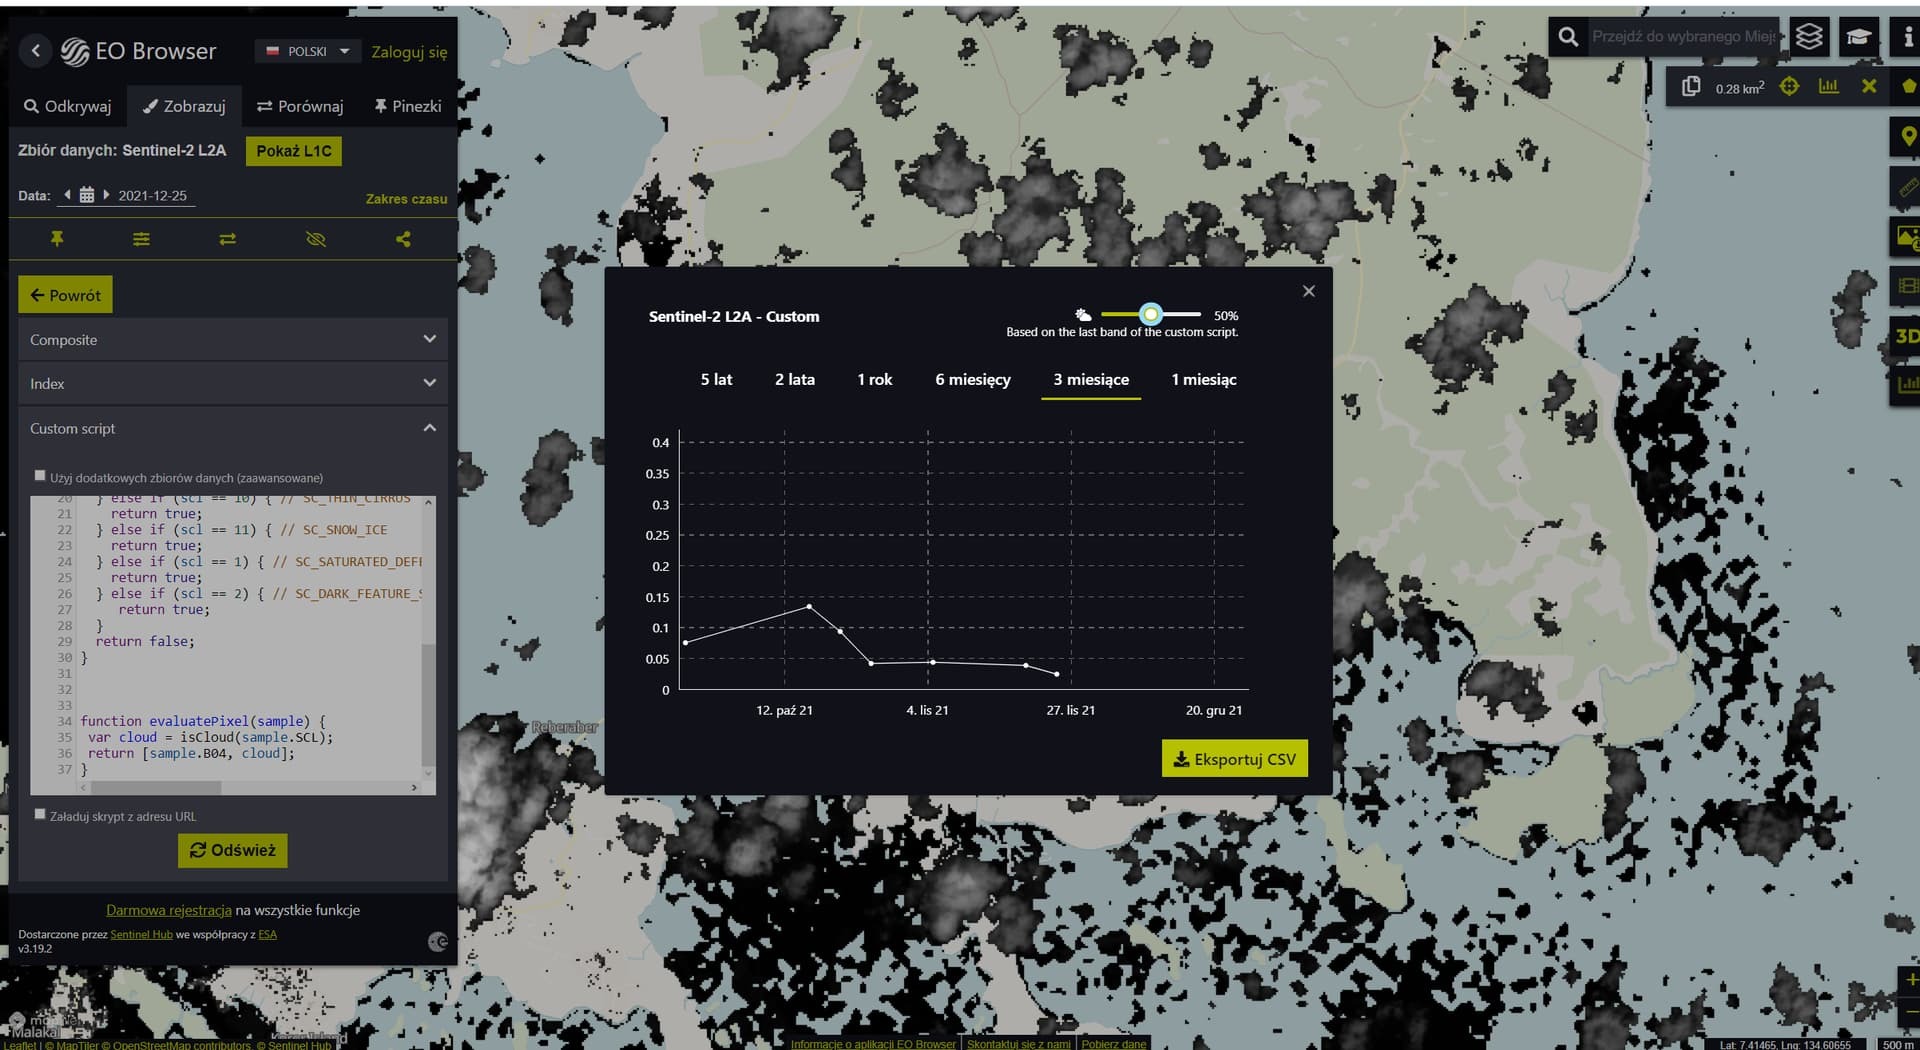
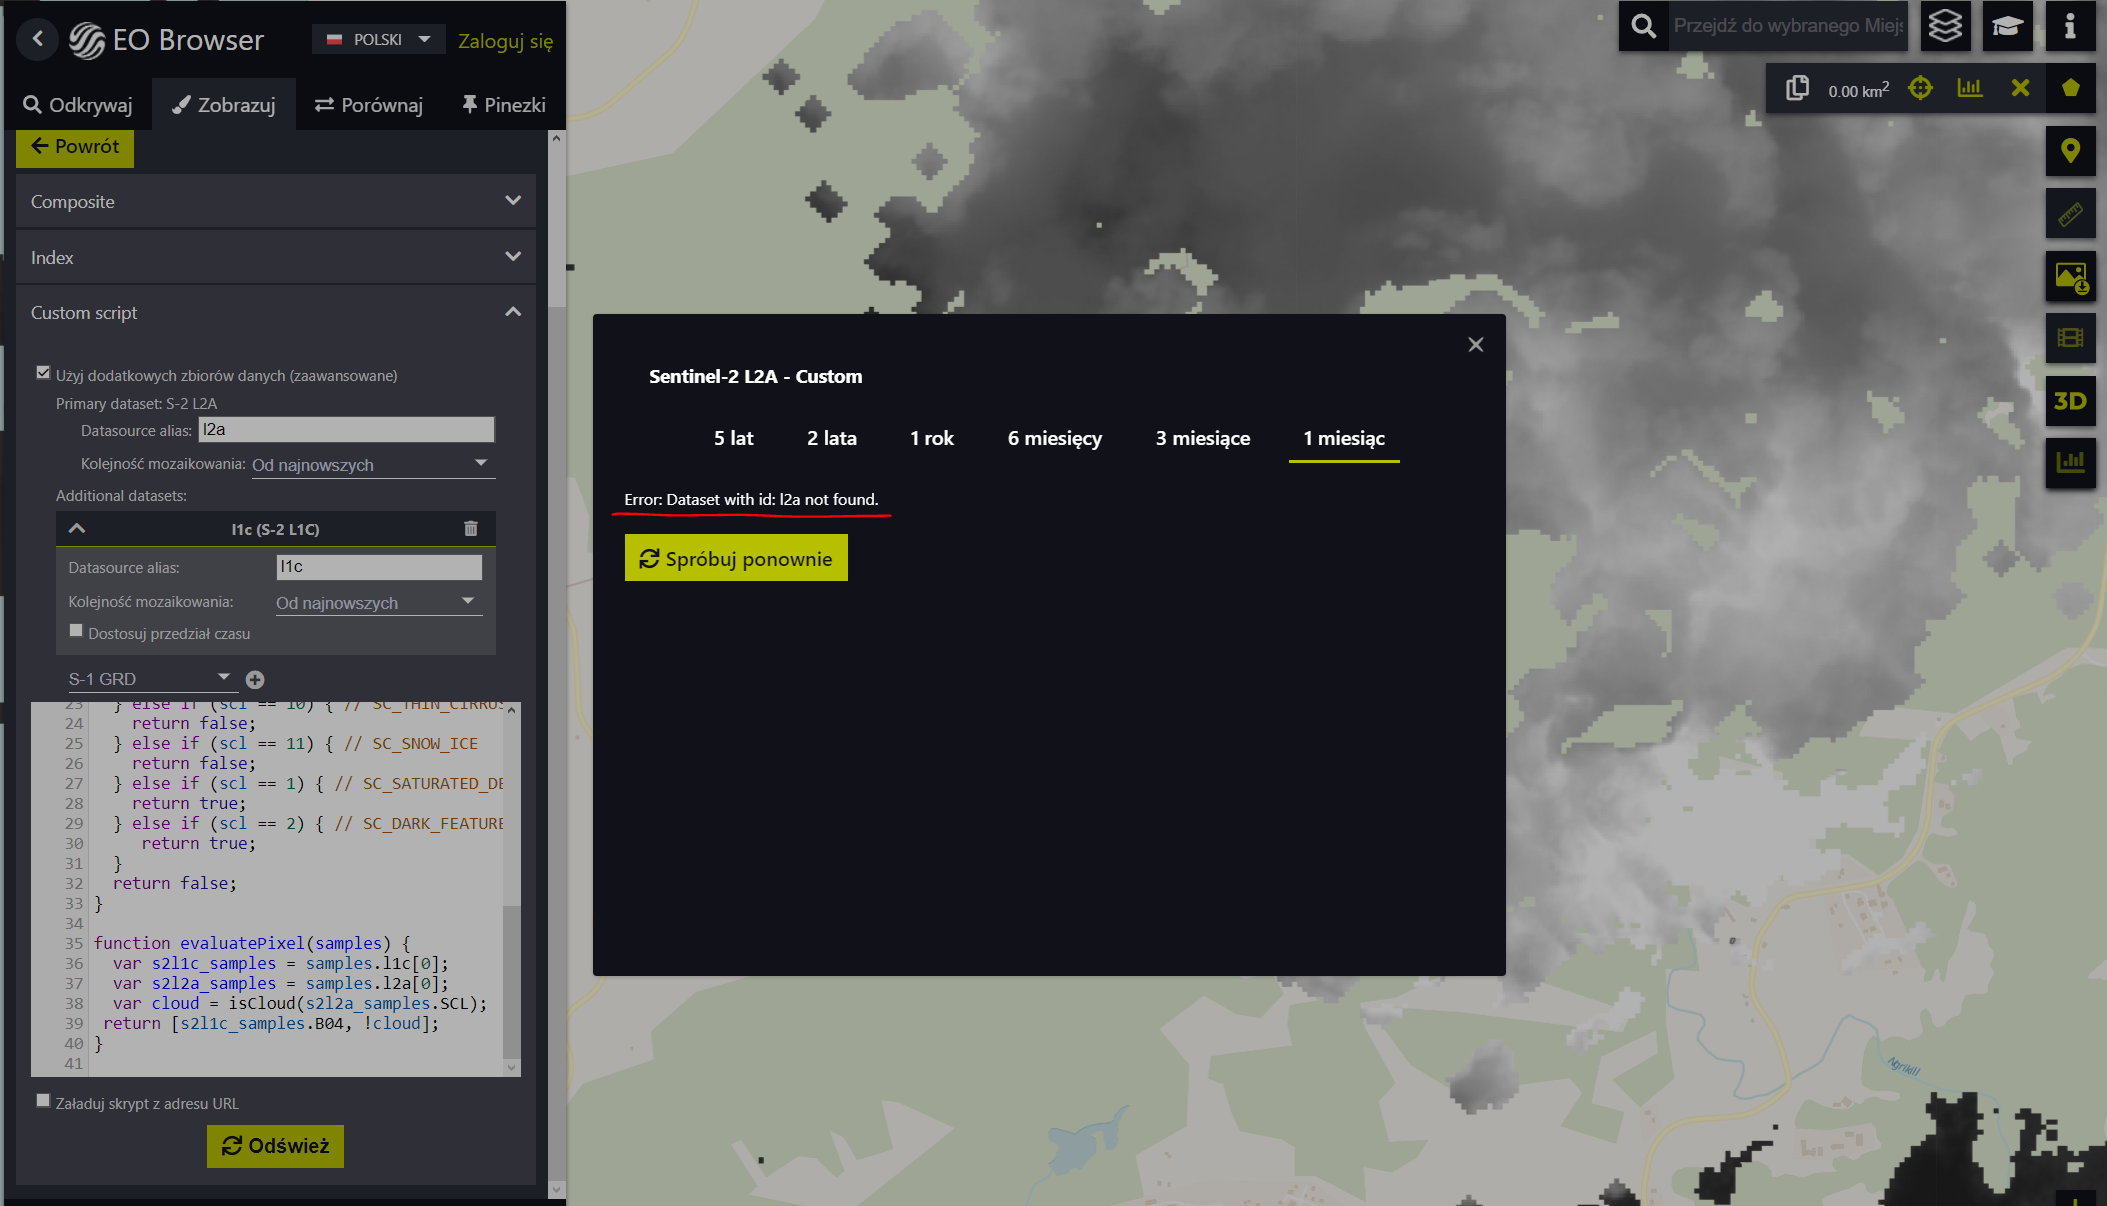
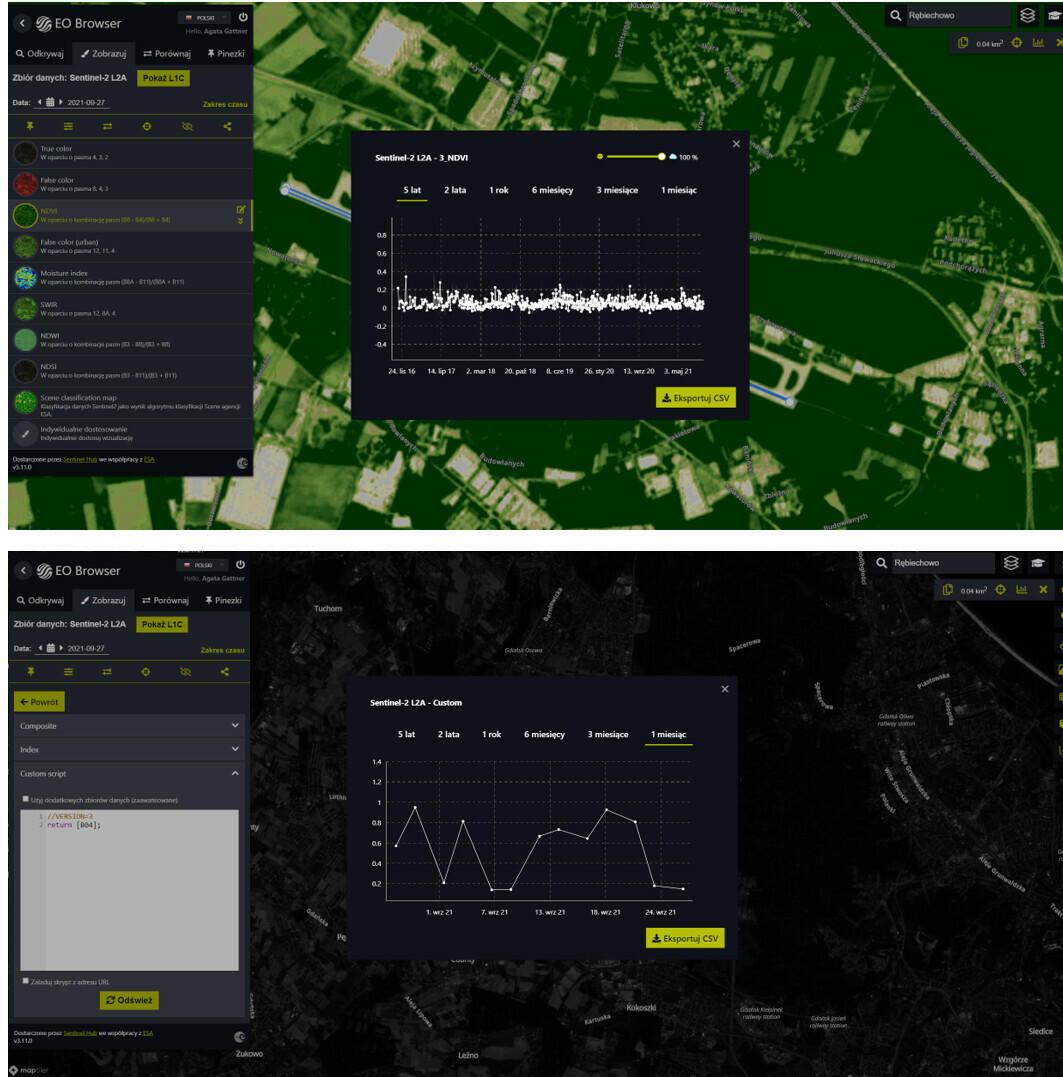
I’m looking around in EOBrowser and i am looking for an answer to the question of how to include% cloudiness in the created time series from one spectral channel. This function is available when selecting a predefined layer, eg NDVI, then in the graph window we have a slider that allows filtering the cloud cover. I would like to achieve a similar effect by analyzing a single channel, eg B04. I return such a layer with a short script return [B04], but in the window when generating the time series, there is no slider with% cloudiness. Is there any way to be able to manipulate the cloud cover in this case? I also wonder what the y axis represents when analyzing a single channel. I conclude that this is the rebound value (just why do values higher than 1 appear - how to explain this). Is there any way to get to the raw data, which stores a DN (Digital Number) in a pixel unprocessed into a reflection value? I have attached two screenshots below to illustrate the situation: NDVI analysis and B04 analysis.
Anyone know the answers to these questions?