I’m starting to try out the Statistical API.
A few questions/comments:
-
If I use e.g. the NDVI eval script from the dashboard config utility, I get a response like this:
‘data’: [{‘interval’: {‘from’: ‘2020-04-26T00:00:00Z’,
‘to’: ‘2020-05-01T00:00:00Z’},
‘error’: {‘type’: ‘EXECUTION_ERROR’}},
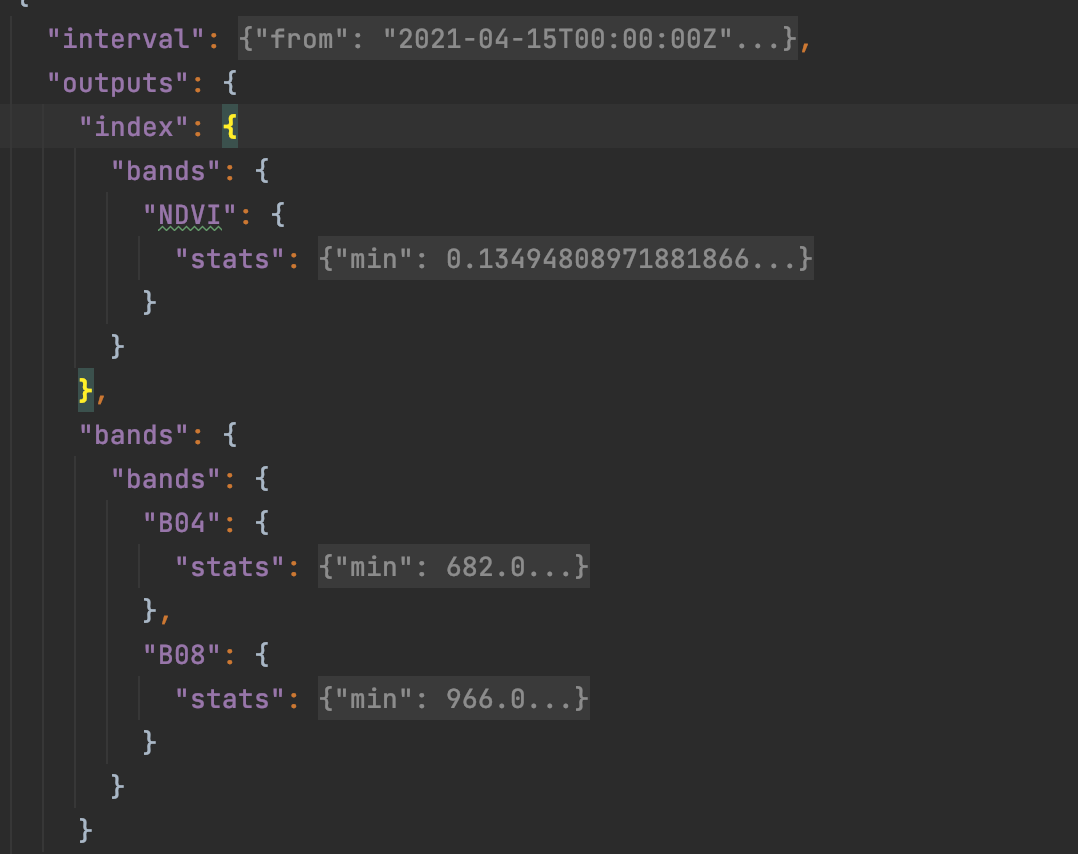
I get it working by adapting the eval script to be like in the examples here: https://docs.sentinel-hub.com/api/latest/api/statistical/examples/ (i.e. named outputs), but what exactly is the problem/what exactly does the stats API require from my eval scripts? -
I don’t see it documented, but the res arguments are in the units of the coordinate reference system specified along with the request geometry. This means if you use epsg: 4326 (units: degrees), but res=10, you always get only one sample back. Therefore:
2a. Leaving out the res argument seems to fall back to the native resolution of the data, what ever crs you use. Is that correct?
2b. What happens if one uses a res larger than the request geometry? If I set res as 100 m, but the geometry is only 50 m in radius, does the response consider the data outside the geometry?
2c. Is there any advantage in speed or processing units to using large res values? Is there any motivation for me to change that from 10 (or just leave it out as in 2a)?
Once again, thanks for proving great services!