
Hi all,
My questions. For introduction and detail see the rest of the post.
- Why is the historical NDVI not available before 2016?
- Why are available data not regular but seem to be randomly distributed in time?
- Why do those characteristics (historical depths and distribution of date availability) change completely from one place to another ?
Disclaimer : I come from data analysis world, not EO. I apologies in advance for all obviously stupid questions I might ask.
Goal :
I want to extract time series of the NDVI average of some different locations on the world.
What I did :
So I used the Statistical info API for that.
Using different places on Earth, I requested available data, and I was surprised, because :
- No matter the dates I choose for the request, there is no data available before 2016
- Available dates are not regularly distributed across the time, but look random
- History and dates distribution is really different from one place to another
One of the request I made : http://services.sentinel-hub.com/ogc/fis/MyID?LAYER=NDVI&STYLE=INDEX&CRS=EPSG:4326&RESOLUTION=10m&TIME=2000-01-01/2018-12-31&BBOX=-54.8625146271707,-68.6261626271707,-54.8544133728293,-68.6180613728293
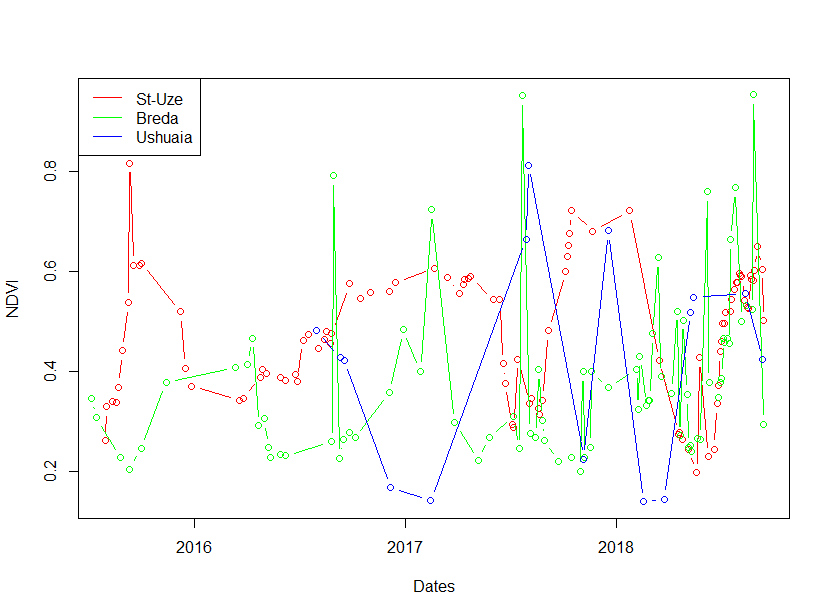
The result I get (the circles are when data is available, lines are intervals without data):
Thanks in advance for your hints.
