Hi,
There has to be a simple solution to this, but I cannot figure it out, sorry for possible repetition.
- I’m trying to compare on-ground measurements with NDVI at specific times on 40 experimental fields.
- I can access WMS images of NDVI in QGIS via the SentinelHub -plugin
- I can download bands B8 & B4 in EObrowser as a tiff and calculate NDVI from those locally
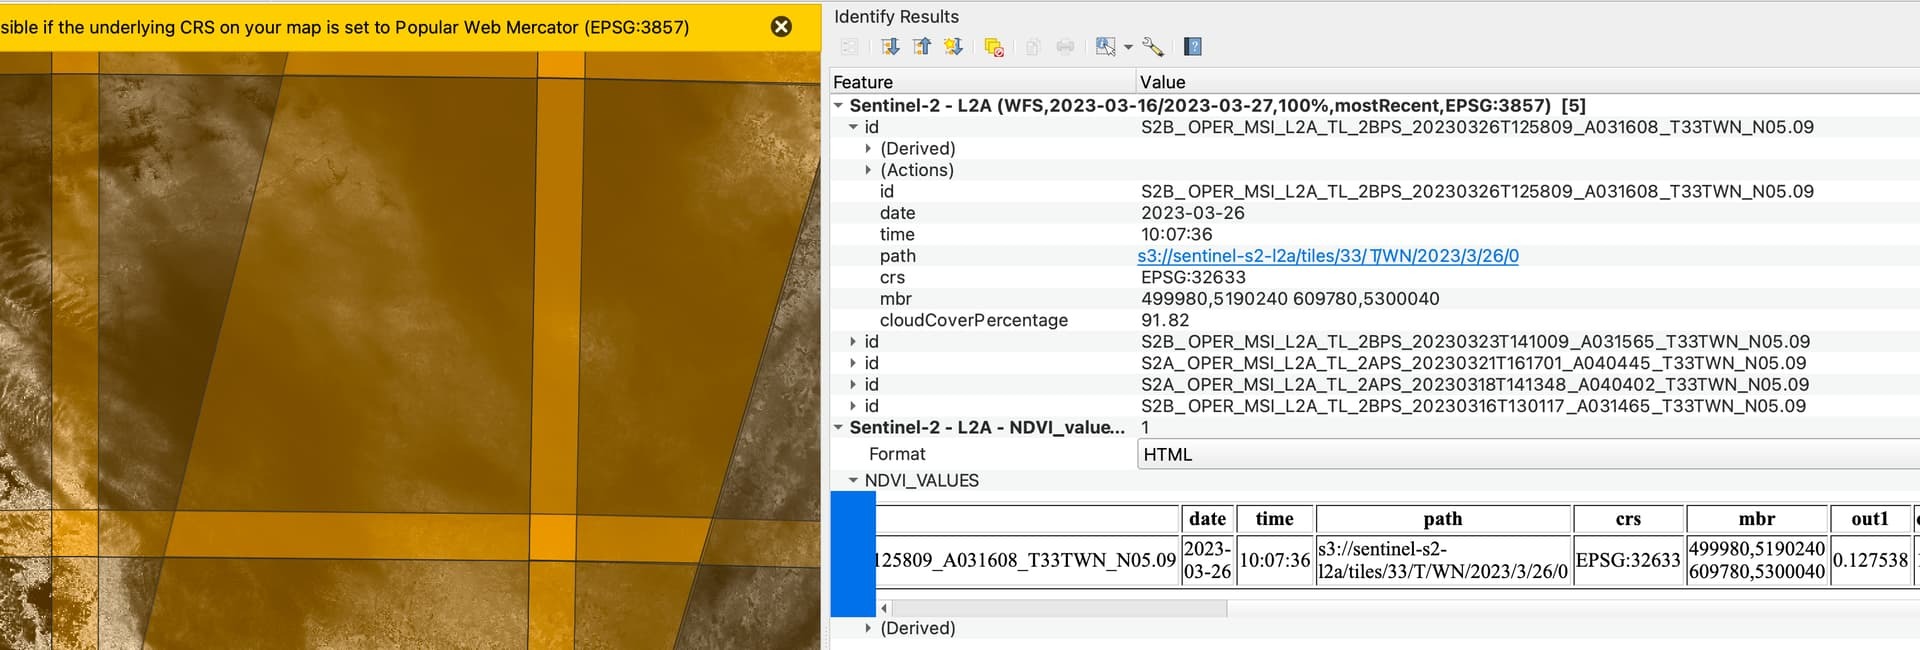
- What I would like to do, is to get a WCS etc. layer with the actual NDVI values, in a form which can be clipped to the field boundaries. I would also like to see, which of the dates around the specific times have good imagery, similar to the SentinelHub plugin.
I tried creating a custom script from this link How can I get actual NDVI values? , but I cannot access it from the SentinelHub plugin (and it would probably give a WMS image anyhow?).
There has to be an easy way to do this. Thanks.