Hello.
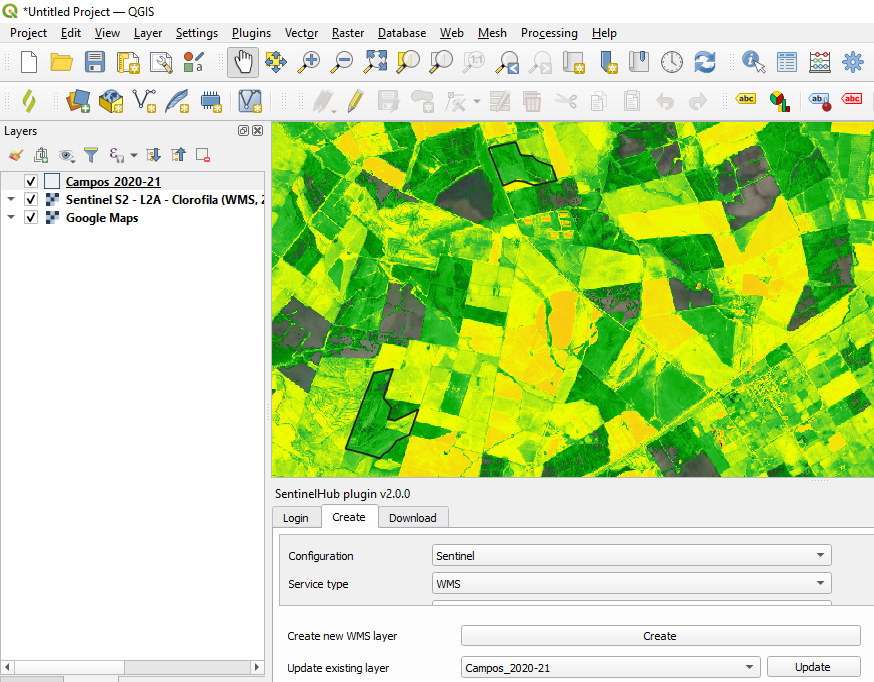
I´m using the QGIS Plugin and I would like to “clip” the visualization created in “Configuration Utility” for the polygons but leave the rest with my base map (Google Maps). How can I do it?
- Home
- Community overview
- Develop
- Analysis APIs
- QGIS Plugin: how to perform visualization parameters only for my polygons
QGIS Plugin: how to perform visualization parameters only for my polygons
- April 26, 2024
- 7 replies
- 123 views
7 replies
- April 26, 2024
Hi,
There are two ways doing this:
- Click the
Add boundsbutton next to theMap boundsin your dashboard and define your interested area on the map usingDraw RectangleorDraw Polygonstools.
Note: In this case only one polygon can be set as your map bounds. - Click
Advanced settingsand insert the coordinates of your interested area. In this case you can set the map bounds with multiple polygons using the code below:
"areaOfInterest": {
"type": "MultiPolygon",
"crs": {
"type": "name",
"properties": {
"name": "urn:ogc:def:crs:EPSG::4326"
}
},
"coordinates": [
[
[
[
15.487843,
47.048137
],
[
15.473415,
47.021461
],
[
15.494714,
47.001329
],
[
15.510516,
47.023334
],
[
15.487843,
47.048137
]
]
],
[
[
[
15.343804,
47.111261
],
[
15.374276,
47.095604
],
[
15.363042,
47.070122
],
[
15.324395,
47.070122
],
[
15.313815,
47.097824
],
[
15.343804,
47.111261
]
]
]
]
},
Note: Don’t forget to change the type of areaOfInterest to Multipolygon.
- Author
- April 26, 2024
Thanks! It worked!
This visualization comes from an index (band combination) that I´m testing. Is there any way to get the mean value of that index for each polygon?
- April 26, 2024
Hi,
Glad to hear that!
To get the mean value of the index for your interested area, please check out our Statistical API which enables you to get statistics calculated based on satellite imagery without downloading any images.
Best,
- Author
- April 26, 2024
Thank you again! I checked the Statistical API and did not find an example with multipolygon. Is it possible to do it with multipolygon?
- April 26, 2024
Hi,
Yes you can do that by setting the bounds parameter to multipolygon as shown below:
"bounds": {
"geometry": {
"type": "MultiPolygon",
"crs": {
"type": "name",
"properties": {
"name": "urn:ogc:def:crs:EPSG::4326"
}
},
"coordinates": [
[
[
[
15.487843,
47.048137
],
[
15.473415,
47.021461
],
[
15.494714,
47.001329
],
[
15.510516,
47.023334
],
[
15.487843,
47.048137
]
]
],
[
[
[
15.343804,
47.111261
],
[
15.374276,
47.095604
],
[
15.363042,
47.070122
],
[
15.324395,
47.070122
],
[
15.313815,
47.097824
],
[
15.343804,
47.111261
]
]
]
]
}
},
- Author
- April 26, 2024
Thank you again! I´m trying to see the statistical info chart in the EO Browser for two or more polygons of my interest. When I tried de “Default” Theme and tried any of the default indices the statistics analysis would work and it shows the index curve, but if I try my custom script I get three curves (C0, C1 and C2) instead of the band math result (image 1)
And if I try my own Configuration (based on one of my configuration utilities) I get the message that statistical info is not available for this configuration (image 2).
The only thing I really need is the result of B08/B03 for each polygon during a particular period of time. Instead of NDVI graph or any other index, I just need the B08/B03 result graph for two or more polygons. I would really appreciate your help with that.
- April 26, 2024
Hi,
Unfortunately EO Browser currently does not support multipolygon, the stat you got from the default layer is probably the value of red, green, and blue band which is not the information we’re interested in. Here’s an webinar showing how to set up statistical feature on EO Browser. Another webinar explaining how to set up layers in dashboard for statistics you may want to take a look.
To get the stats of each polygon you’re interested in, I suggest to use the statistical api and make a request for each polygon in a loop.
Note: If you set the geometry as multipolygon and sent a request to the statistical api, the response would be the stat of all polygons in the multipolygon, which might not be the result you need.
Enter your E-mail address. We'll send you an e-mail with instructions to reset your password.
Scanning file for viruses.
Sorry, we're still checking this file's contents to make sure it's safe to download. Please try again in a few minutes.
OKThis file cannot be downloaded
Sorry, our virus scanner detected that this file isn't safe to download.
OK
©
2025
Planet Labs PBC. All rights reserved.
|
Privacy Policy
|
California Privacy Notice
|
California Do Not Sell
Your Privacy Choices
|
Cookie Notice
|
Terms of Use


