
Plot sentinel1 image creates weird dots image

  • April 26, 2024
  • 4 replies
  • 128 views

I have created in my confiduration sentinel 1 layer by inserting the following script in the costum sccript editor:

return [VV,VH, 2 * VH, VV / VH / 100.0]

( like in the documentation + VH channel).

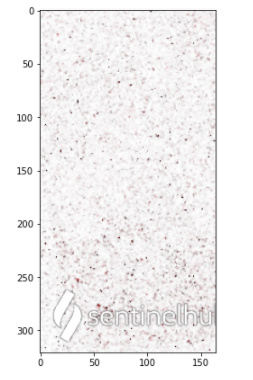
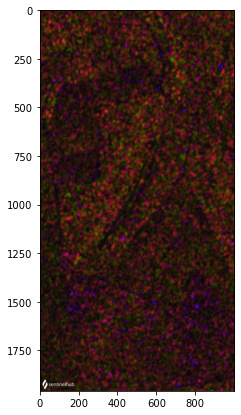
I used wms_Request and get data and then plot the image but I got image with dots :

 bbox_size,bbox,bbox_coords_wgs84=get_bbox_from_shape(shapes,10)


s1_request = WmsRequest(
    data_collection=DataCollection.SENTINEL1_IW,
    layer='TRUE-COLOR-S1-IW',
    bbox=bbox,
    time=('2020-11-01', '2021-01-10'),
    width=bbox_size[0],
    config=config
)

s1_data = s1_request.get_data()


plot_image(s1_data[-3])

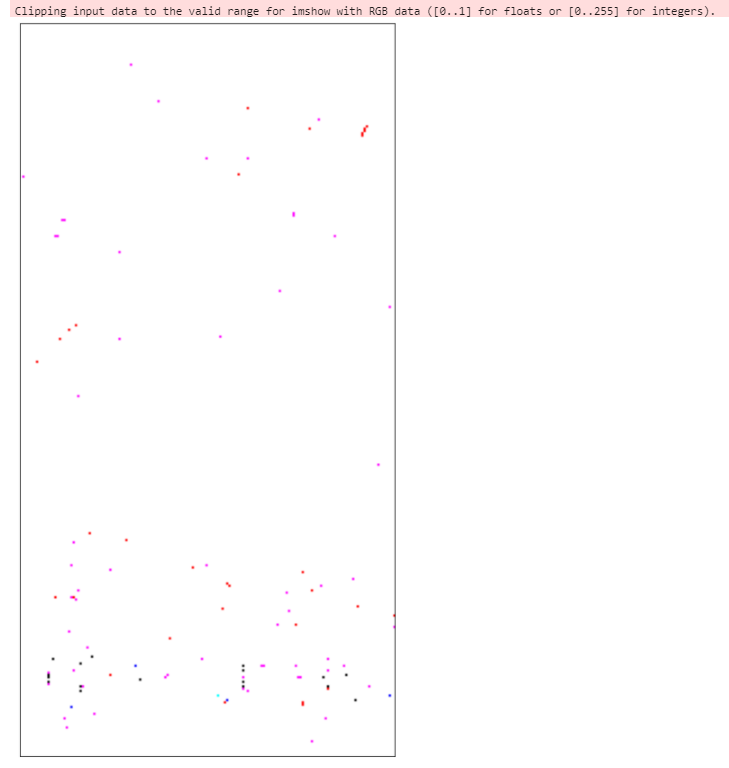
I’m not sure why is this hapenning ans would love to understand it better and get help with hoe to solve it.

4 replies

From your error, it seems that the values returned are outside the range that the function can plot (0-1 or 0-255).

Can you share your bbox to reproduce (because it works for me over some random bbox)?


so the values 0-255 source is from the plot image fucntion? though also when I print the array I get 0-255 values
tthis is the bbox:

[-47.949734553694725,
-8.746513680257486,
-47.93459851294756,
-8.717573061584929]


Is your plot function the following?

def plot_image(image, factor=1):
    """
    Utility function for plotting RGB images.
    """
    fig = plt.subplots(nrows=1, ncols=1, figsize=(15, 7))

    if np.issubdtype(image.dtype, np.floating):
        plt.imshow(np.minimum(image * factor, 1))
    else:
        plt.imshow(image)

Because running over the BBox you gave me returns this:

image


Is very weird, if I use the evaluate script with your plot_image function I get:

and if I use the WmsRequest it looks like this (same plot_image function):
image

both values are in UINT8