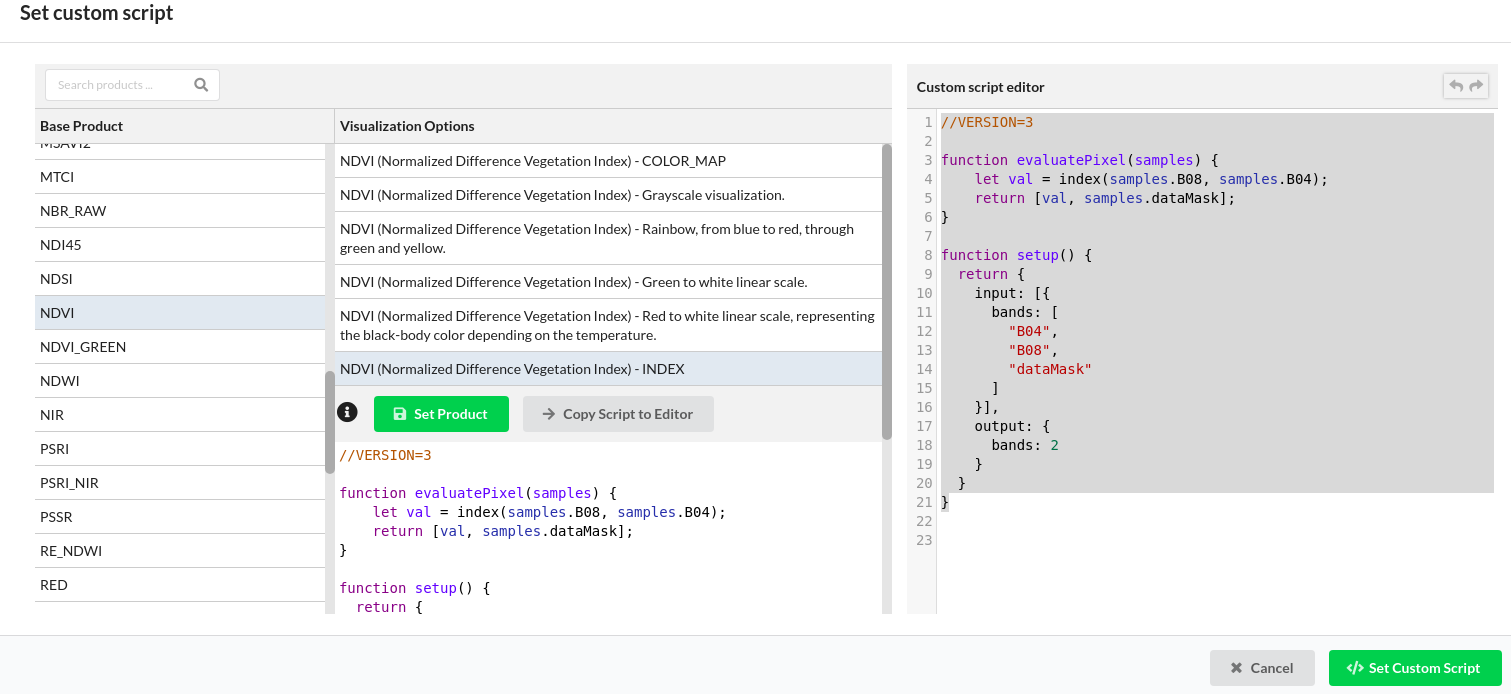
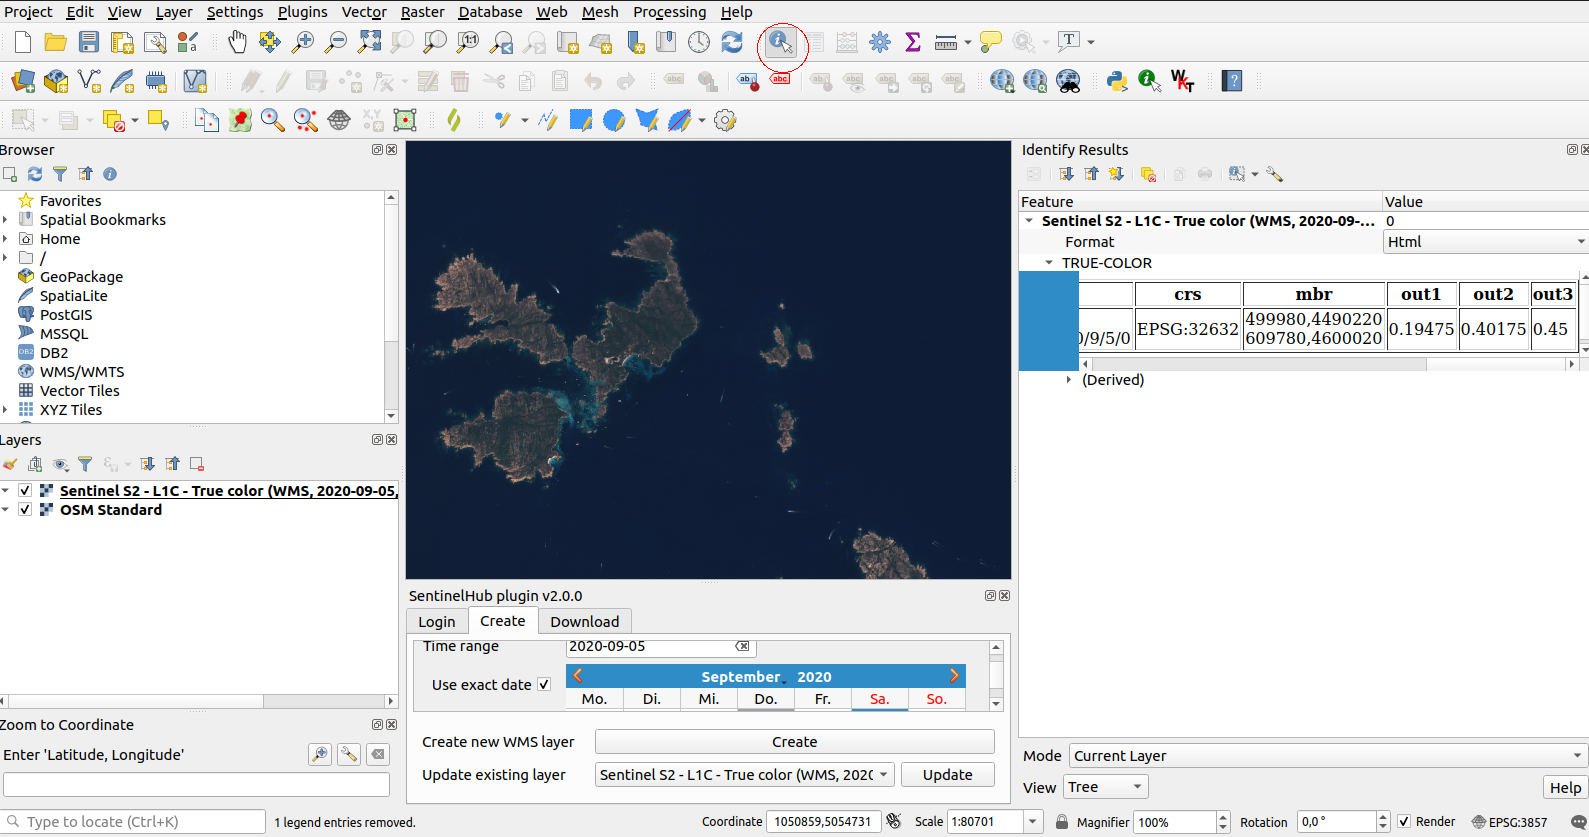
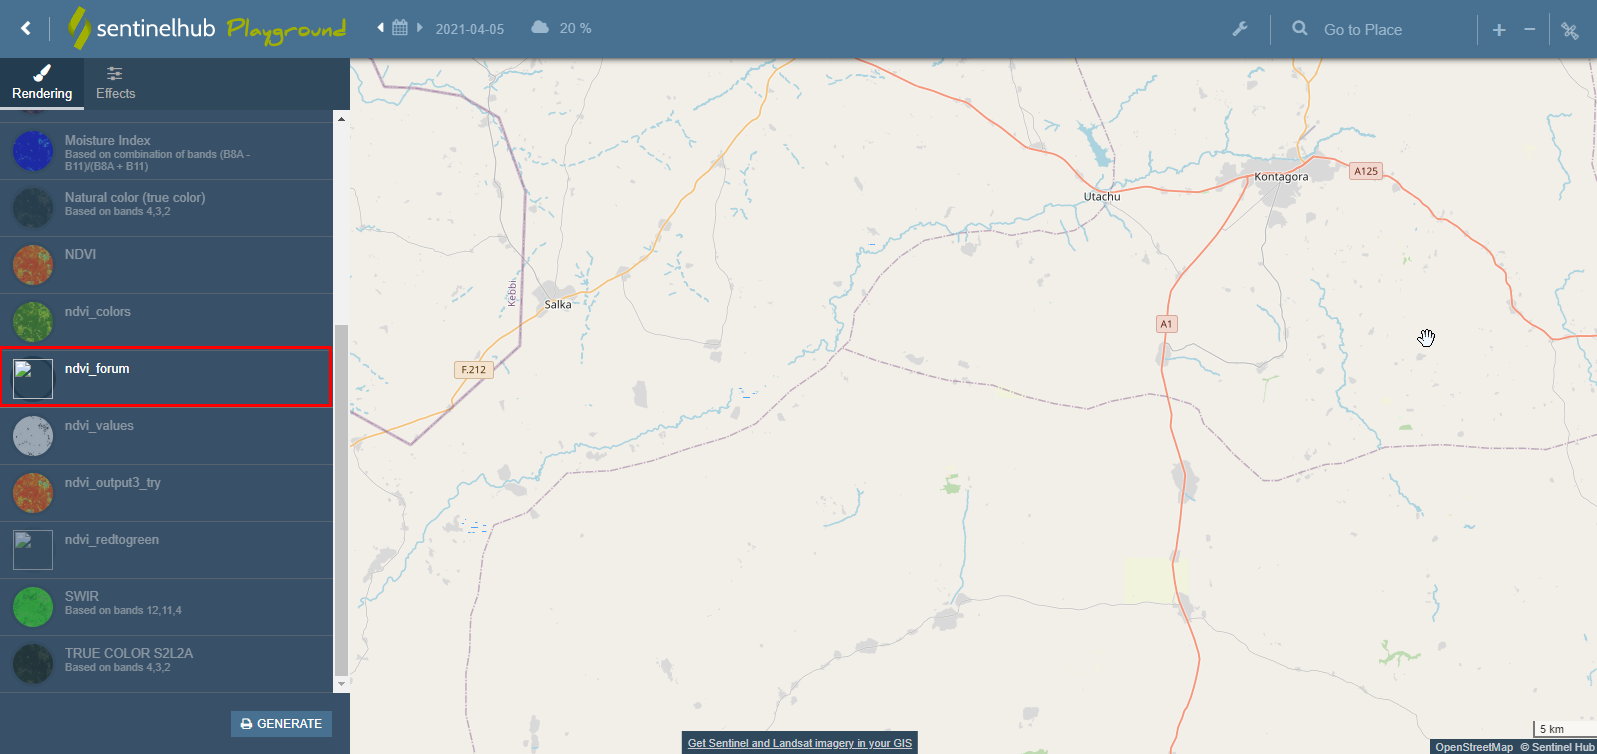
I added a couple of layers to my webapp and connected them to Qgis, and I was wondering if there is way to display a pixel’s value when I click or point at it
- Home
- Community overview
- Develop
- Analysis APIs
- Pixel value display
Pixel value display
- April 26, 2024
- 17 replies
- 134 views
17 replies
- Author
- April 26, 2024
yes that’s what i did, but it gives me 3 different values. I’m using the NDVI layer, and I need to know the ndvi value in a certain pixel
- April 26, 2024
Ah, I understand. That is because you are creating a layer that returns a visualisation of NDVI (in the Red, Green and Blue channels) and not the actual NDVI values. If you want NDVI values, I would recommend to add a layer in your dashboard (along-side other layers) where you call the NDVI values. When you create the layer you can access some pre-made templates, including the “raw” NDVI. Under set Custom Script.
Otherwise you can copy this script for your layer:
//VERSION=3
function evaluatePixel(samples) {
let val = index(samples.B08, samples.B04);
return [val, samples.dataMask];
}
function setup() {
return {
input: [{
bands: [
"B04",
"B08",
"dataMask"
]
}],
output: {
bands: 2
}
}
}
When queried in QGIS, you get out1 = NDVI and out2= Datamask.
- April 26, 2024
Hello,
If you are using the latest version of the plugin with an updated version of QGIS, you can access the pixel values via the Identify features tool. See the screen-shot below (tool circled in red):
The tool opens a side pane where you can unroll the layer name and get the values (out1, out2, out3, etc…) in a table.
- Author
- April 26, 2024
Alright, I will try this and get back to you. Thank you so much
- Author
- April 26, 2024
the problem is there aren’t the colors I want in the visualization options
- April 26, 2024
Hello again,
No problem: the visualisation options are just templates that we made for the most common cases. You can create any visualisation that you want (almost) by writing it yourself in the Custom script editor. Here is the page with the documentation on how to write different types of visualisation so that you can display the data exactly as you want.
Maxim
- Author
- April 26, 2024
how can I add this color visualization:
const visualizer = ColorGradientVisualizer.createRedGreen(0.0, 1.0);
visualizer.process(0.0); // returns [ 0.8431372549019608, 0.0980392156862745, 0.1098039215686275 ]
visualizer.process(0.3); // returns [ 0.992156862745098, 0.5764705882352941, 0.5764705882352941 ]
visualizer.process(0.5); // returns [ 0.9058823529411765, 1, 0.2352941176470588 ]
visualizer.process(0.8); // returns [ 0.5450980392156863, 0.7686274509803922, 0.2666666666666667 ]
visualizer.process(1.0); // returns [ 0.0705882352941176, 0.4627450980392157, 0.0392156862745098 ]
// Returns ColorGradientVisualizer
// ColorRampVisualizer
To this NDVI script:
//VERSION=3
function setup() {
return{
input: [{
bands: ["B04", "B08"]
}],
output: {
id: "default",
bands: 1,
sampleType: SampleType.FLOAT32
}
}
}
function evaluatePixel(sample) {
let ndvi = (sample.B08 - sample.B04) / (sample.B08 + sample.B04)
return [ ndvi ]
}
??
PS. I don’t have a background in Coding or Web, that’s why my questions may sound dumb 😛
- Author
- April 26, 2024
But when I return 3 bands i lose again the ndvi values. How can I have the ndvi value in the output while having the colors I want please?
- April 26, 2024
This is not possible to “pack” in the 3-band layer. You could output 4-band, where first three bands would represent colors and the fourth one NDVI value. But then you would probably have a hard time finding software that can read this.
It probably makes sense to create two layers - one with colors and one with values.
- April 26, 2024
A visualiser takes values and maps them to RGB colours. Therefore the first step is to return 3 bands (or 4 if you want to make noData areas transparent).
Then you can call the visualiser and you are done 🙂
In the following scripts you can tailor the bounds of the data (0.0 and 1.0) to tweak the visualisation range.
For 3 bands:
//VERSION=3
function setup() {
return{
input: [{
bands: ["B04", "B08"]
}],
output: {
id: "default",
bands: 3,
sampleType: "AUTO"
}
};
}
// Map NDVI from Dark Green to White (between 0 and 1): adjust to liking
const visualizer = ColorGradientVisualizer.createWhiteGreen(0, 1.0);
function evaluatePixel(sample) {
// Calculate ndvi
let ndvi = (sample.B08 - sample.B04) / (sample.B08 + sample.B04);
// Return color mapped NDVI (0 to 1)
return visualizer.process(ndvi);
}
An example here.
For 4 bands (3 bands + transparency):
//VERSION=3
function setup() {
return{
input: [{
bands: ["B04", "B08", "dataMask"]
}],
output: {
id: "default",
bands: 4,
sampleType: "AUTO"
}
};
}
// Map NDVI from Dark Green to White (between 0 and 1): adjust to liking
const visualizer = ColorGradientVisualizer.createWhiteGreen(0, 1.0);
function evaluatePixel(sample) {
// Calculate NDVI
let ndvi = (sample.B08 - sample.B04) / (sample.B08 + sample.B04);
// Get color mapped NDVI (0 to 1)
let ndvi_vis = visualizer.process(ndvi);
// Return colormap + nodata mask as transparency
return [ndvi_vis[0], ndvi_vis[1], ndvi_vis[2], sample.dataMask];
}
An example here: notice outside the orbit, the data is no longer white but transparent.
- Author
- April 26, 2024
And how could I output 4-bands, where first three bands would represent colors and the fourth one NDVI value?
- April 26, 2024
Something along these lines:
//VERSION=3
function setup() {
return{
input: [{
bands: ["B04", "B08", "dataMask"]
}],
output: {
id: "default",
bands: 5,
sampleType: "FLOAT32"
}
};
}
// Map NDVI from Dark Green to White (between 0 and 1): adjust to liking
const visualizer = ColorGradientVisualizer.createWhiteGreen(0, 1.0);
function evaluatePixel(sample) {
// Calculate NDVI
let ndvi = (sample.B08 - sample.B04) / (sample.B08 + sample.B04);
// Get color mapped NDVI (0 to 1)
let ndvi_vis = visualizer.process(ndvi);
// Return colormap + nodata mask as transparency
return [ndvi_vis[0], ndvi_vis[1], ndvi_vis[2], ndvi, sample.dataMask];
}
- April 26, 2024
Can you explain a bit more into details on what you have tried and what it means “it does not work”?
If we are to help you, we need to understand your steps to the level that we can repeat them.
- Author
- April 26, 2024
- April 26, 2024
As mentioned above: “But then you would probably have a hard time finding software that can read this.”
Sentinel Playground, along with most other web GIS applications expects the tiles to be 3-band, providing information about “red”, “green” and “blue”. Sentinel Hub services can provide mutli-band output, but you will need to develop your own software to read these results. Sentinel Playground is not one of these.
- Author
- April 26, 2024
AH now I understand. Alright, thank you so much for your help 🙏
Enter your E-mail address. We'll send you an e-mail with instructions to reset your password.
Scanning file for viruses.
Sorry, we're still checking this file's contents to make sure it's safe to download. Please try again in a few minutes.
OKThis file cannot be downloaded
Sorry, our virus scanner detected that this file isn't safe to download.
OK
©
2025
Planet Labs PBC. All rights reserved.
|
Privacy Policy
|
California Privacy Notice
|
California Do Not Sell
Your Privacy Choices
|
Cookie Notice
|
Terms of Use


