Solved

Understanding band composition in Planet scope data.

  • 5 July 2023
  • 2 replies
  • 124 views

Userlevel 1
Badge +2

Hi
I have downloaded the data for my study sites. It comprises 6 scenes.

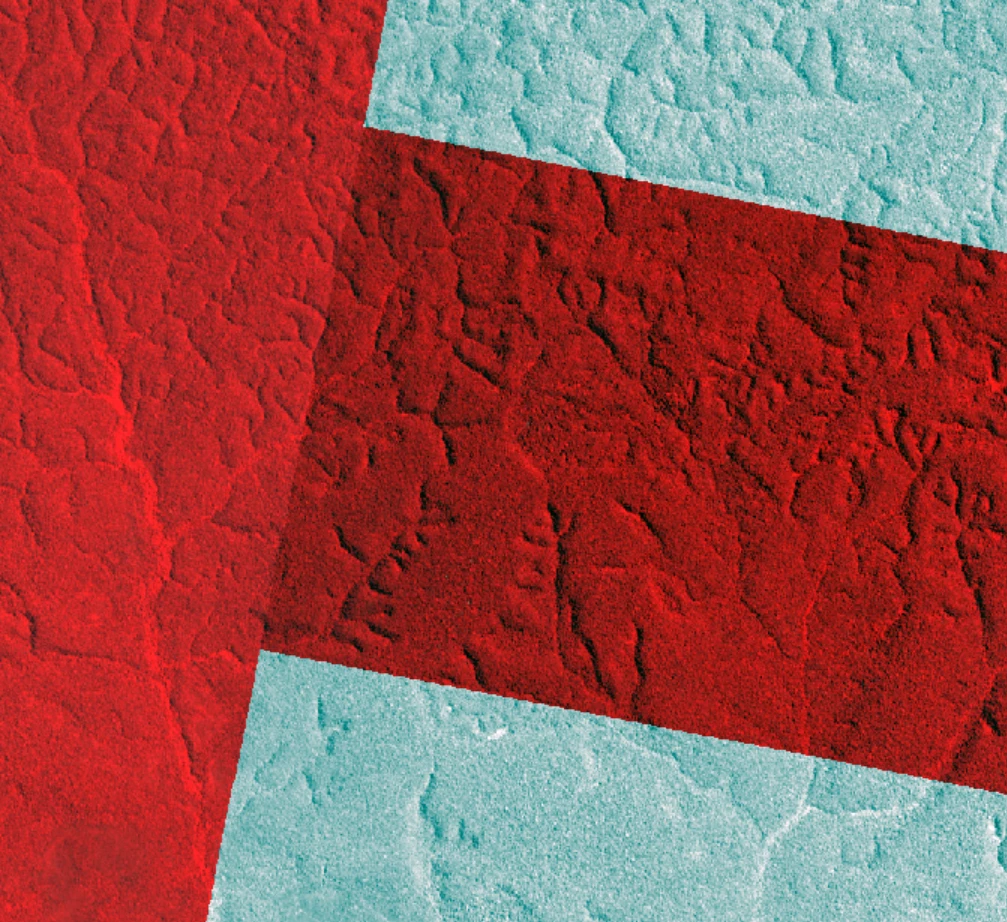
For one month i downloaded the composite image but it seems like the different scene has different stretching effect.
So i downloaded the individual scenes separately to mosaic.
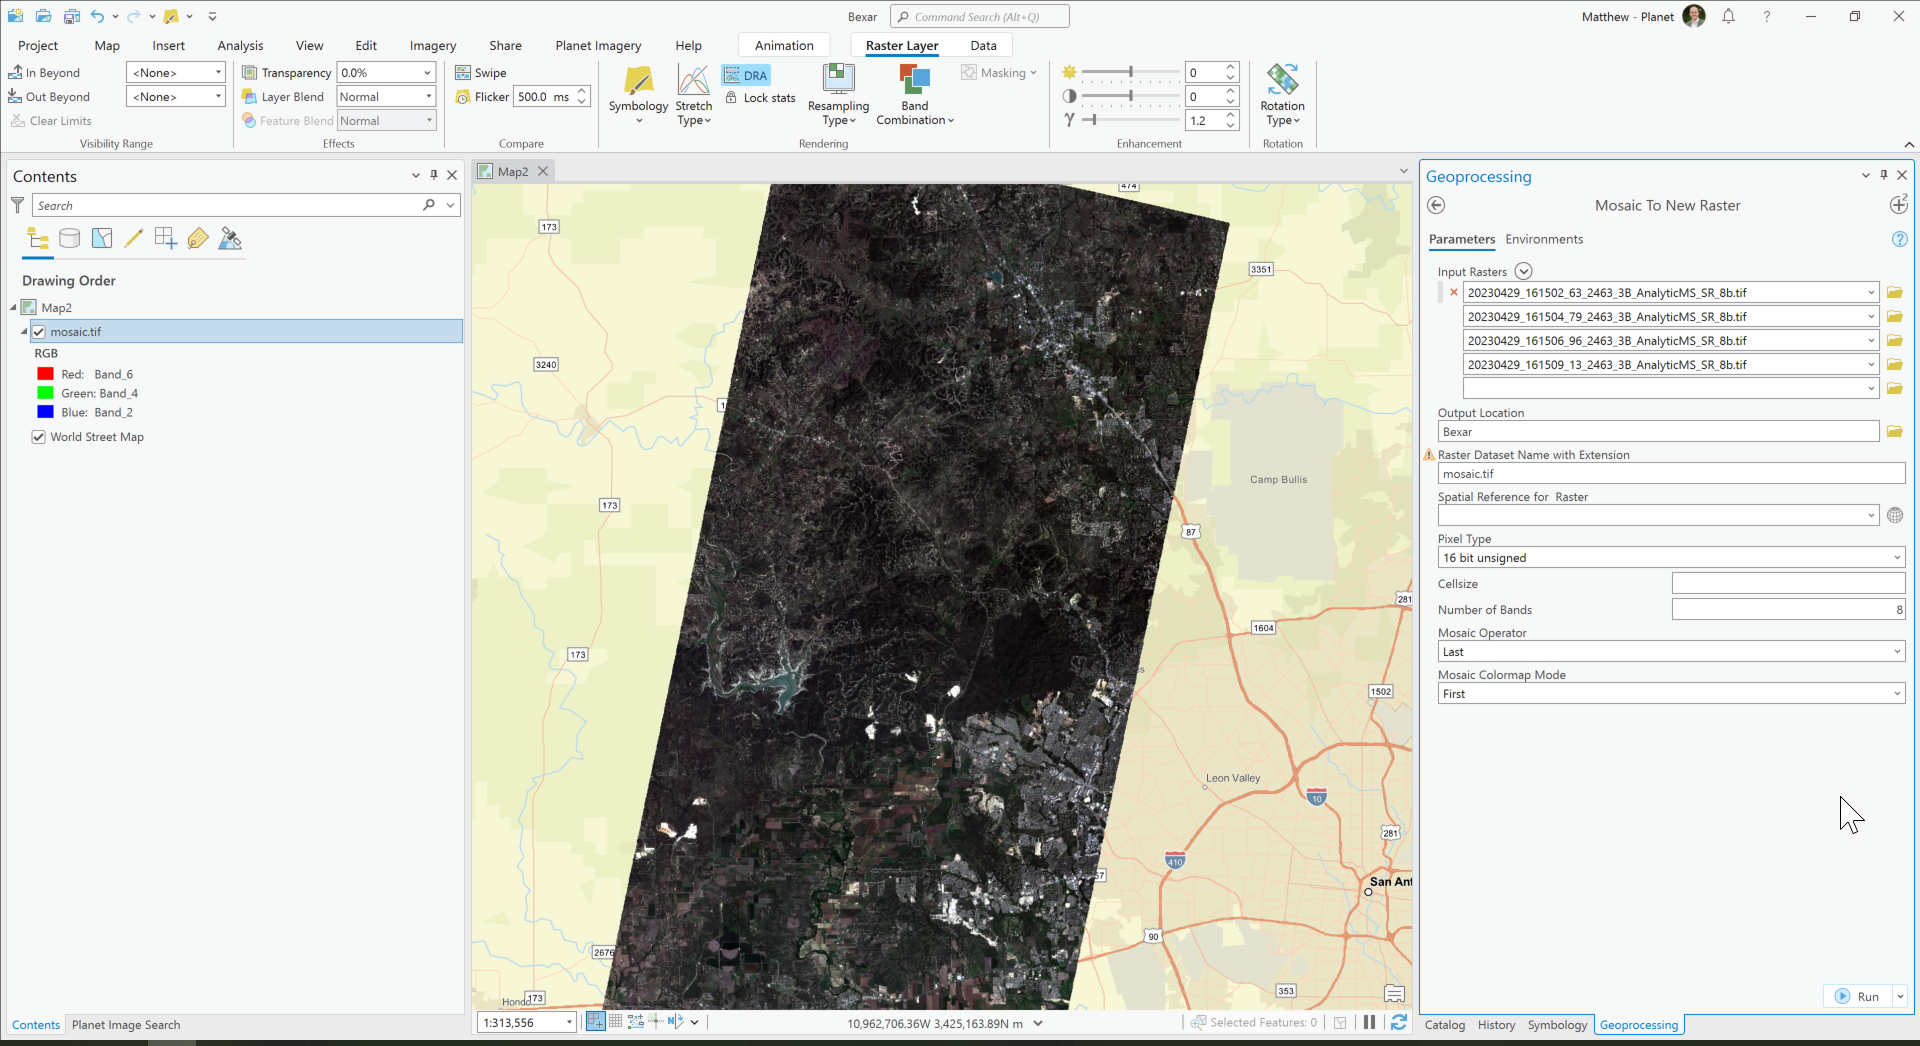
I tried to mosaic each band of the scene using ArcGIS, mosaic to new raster tool.

But i am mosaicking a single band but the output is becoming an RGB image.
Can anyone help me out of this confusion. I have attached the image of mosaicking of band-4 from each scene but the output is an RGB image. This is for your kind reference.


icon

Best answer by matt.ballard 6 July 2023, 18:01

View original

2 replies

Userlevel 2
Badge +4

Hi Swapna!

Below is a screenshot of the parameters that I used in the “Mosaic to New Raster” tool and the resulting mosaic that was created.  

It sounds like you are trying to mosaic only one spectral band, is that correct? I would recommend mosaicking the multi-band rasters that we deliver, versus splitting them into single-band rasters. If you do need to visualize/analyze a specific spectral band - you use can use tools like Make Raster Layer or Raster Calculator.


If you then want to visualize a specific band instead of a multiband RGB visualization, you can use the stretch symbology option. 

You might also want to explore using Mosaic Datasets as an alternative to this tool. You can read more about how we suggest doing this in our documentation. I believe this would be a faster and more efficient tool for mosaicking in ArcGIS.


Let us know if that works for you!

Userlevel 1
Badge +2

Thank you so much.
 

Reply